Working with data
Storing data is one thing, but we want to work with it. The following examples illustrate reading of data from DataArray, Tag and MultiTag entities. We will use the dummy dataset already used in the tagging example. The figure below shows what is stored in the dataset.
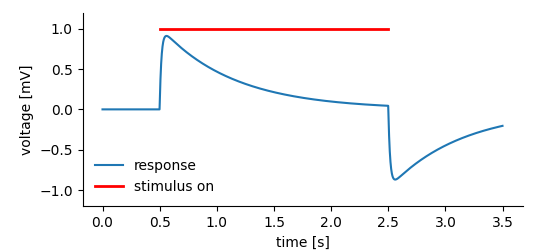
At some instance in time a system was exposed to a stimulus that leads to the system’s response. The response has been recorded and stored in a DataArray, a Tag is used to highlight the “stimulus-on” segment of the data.
    time, _, response = create_data()

    f = nixio.File.open("tagging1.nix", nixio.FileMode.Overwrite)
    block = f.create_block("demo block", "nix.demo")
    data = block.create_data_array("response", "nix.sampled", data=response)
    data.label = "voltage"
    data.unit = "mV"

    data.append_sampled_dimension(interval, label="time", unit="s")

    stim_tag = block.create_tag("stimulus", "nix.stimulus_segment", position=[stim_on])
    stim_tag.extent = [stim_off - stim_on]
    stim_tag.references.append(data)
In this example we know the interesting entities by name, i.e. the DataArray is called response and the Tag is called stimulus. In cases in which we have no clue about the names, we just have to browse the file or search by name or type.
Reading data
The first and maybe most common problem is to read the data stored in a DataArray.
Reading all data
In NIX when you open a DataArray the stored data is not automatically read from file. This keeps the object lightweight and easy to create. To read the data you can simply access it in a numpy style:
    print(data_array.shape)
    data = data_array[:]
    time = data_array.dimensions[0].axis(len(data))
There are a few noteworthy things:
- We use some previous knowledge here. For one, we know the names of the entities. Further, we know that the data is 1-D and the single dimension is a
SampledDimension. If these things are not known, the NIX library offers the necessary functions to get this information. DataArray.shapereturns a tuple with the data shape.DataArray.dtypereturns the data type.- To find out the
DimensionType, we need to access the dimension:
for dim in data_array.dimensions:
    print(dim.dimension_type)
Reading partial data
In other instances it might be wanted to read only parts of the data. Reading slices of the data is straight forward using the numpy style.
    # let's read the 101 to 1000th element of the data
    partial_data = data_array[100:1000]
    time = data_array.dimensions[0].axis(900, 100)
    print(partial_data.shape, len(time))
An alternative approach is to use the DataArray.get_slice method which by default works with indices but can also work in data coordinates. E.g. we know that the data is 1-D and covers a span of 3.5s and we want to have the data in the interval 0.5s through 1.75s. The method returns a nixio.DataView object. The actual reading is done by accessing the data.
    # using the get_slice method to get the data in the interval 0.5 to 1.75 s
    partial_data = data_array.get_slice([0.5], [1.25], nixio.DataSliceMode.Data)[:]
    time = np.arange(0.5, 0.5 + 1.25, data_array.dimensions[0].sampling_interval)
    print(partial_data.shape, len(time))
The arguments positions and extents are passed as lists. There must be one entry for each dimension of the data. In this case, since the data is 1-D, positions and extents are 1-element lists.
Note: the slice is defined by the starting point(s) and the extent(s), not with start and end points.
Reading tagged data
Tag and MultiTag tag single or multiple points or regions in data stored in the referenced DataArrays (see tagging for more information and the example data created in the example will be used in the following code snippets).
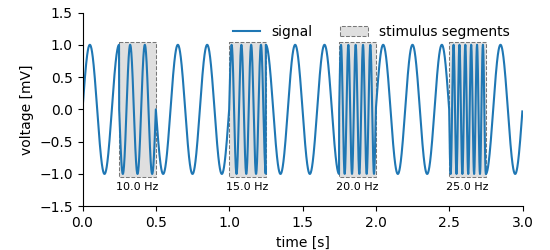
Plot of the data created by this example on tagging multiple regions in data.
In order to read the data that belongs to the highlighted region(s) Tag and MultiTag define the tagged_data methods which return nixio.DataView objects from which the data is read as shown above. The following code snippet shows how to use these function:
tagged_data method (example code).¶ block = nixfile.blocks[0]
mtag = block.multi_tags[0]
signal_da = mtag.references["signal"]
signal_dim = signal_da.dimensions[0]
xlabel = "%s %s" % (signal_dim.label, "[%s]" % signal_dim.unit if signal_dim.unit else "")
ylabel = "%s %s" % (signal_da.label, "[%s]" % signal_da.unit if signal_da.unit else "")
fig = plt.figure(figsize=(5.5, 2.5))
num_segments = len(mtag.positions[:])
for i in range(num_segments):
data = mtag.tagged_data(i, "signal")[:]
time = signal_dim.axis(len(data), start_position=mtag.positions[i])
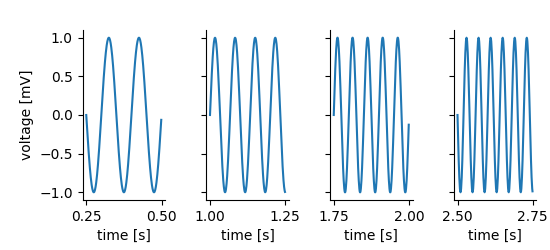
The MultiTag version of the tagged_data method takes two arguments. The first is the index of the tagged region (0 for the first), the second argument is the name of the referenced DataArray (you can also use the index or the id). Since the Tag tags only a single region, it takes only one argument, i.e. the name (id, index) of the referenced DataArray.
Analogously, the feature data attached to the Tag or MultiTag can be
obtained using the feature_data methods.
feature_data works analogously, the first argument is the index of the tagged region, the second the name (or id or index) of the feature. Here the feature stores a single number, i.e. the frequency of the stimulus for each tagged region which is plotted below the highlighted regions in the figure above (example code).¶ for i, (interval, extent) in enumerate(zip(mtag.positions[:], mtag.extents[:])):
rect = patches.Rectangle((interval, 1.05), extent, -2.1, alpha=0.5,
facecolor="silver", edgecolor='k', lw=0.75, ls='--')
ax.add_patch(rect)
ax.text(interval + extent / 2, -1.25,
"%.1f %s" % (mtag.feature_data(i, "stimulus frequency")[:],
mtag.features["stimulus frequency"].data.unit), fontsize=8, ha="center")
ax.legend((l, rect), (signal_da.name, mtag.name), loc=1, frameon=False, ncol=2)