Tagging points and regions
The DataArrays store data, but this is not all that is needed to store scientific data. We may want to highlight points or regions in the data and link it to further information.
This is done using the Tag and the MultiTag, for tagging single or multiple points or regions, respectively.
The basic idea is that the Tag defines the point (and extent) with which it refers to points (or regions) in the data. A tag can point to several DataArrays at once. These are mere links that are stored in the list of references. The following figure illustrates, how a MultiTag links two DataArrays to create a new construct.
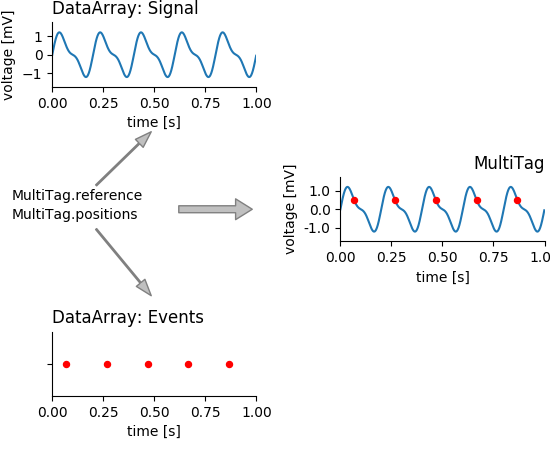
MultiTags tag several points or regions in referenced DataArrays. By binding entities together they can provide context.
Tagging in 1-D
Suppose, we are recording the response of a system to a certain stimulus.
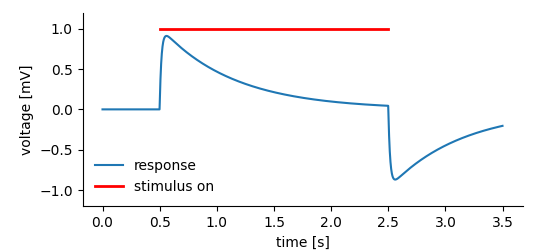
A system’s response to a stimulus that was on for a certain amount of time.
We may want to store:
- The recorded system’s response before, during, and after the stimulus.
- The time span the stimulus was on.
In the NIX data model Tag entities are used to tag regions in a DataArray. For this, the Tag refers to the DataArray and stores position and extent of the highlighted segment.
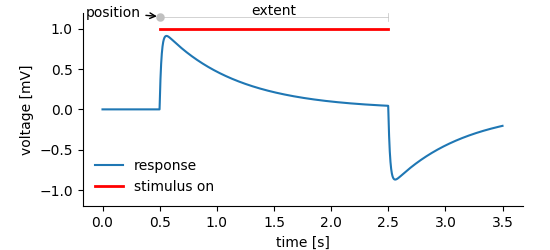
The system’s response is stored in a DataArray, we do need to add information about the start position and the extent of the stimulus-on segment. The extent is optional, if not specified. the Tag/MultiTag tags only a point in the data.
The following code snippet shows how to create the Tag.
example code¶ time, _, response = create_data()
f = nixio.File.open("tagging1.nix", nixio.FileMode.Overwrite)
block = f.create_block("demo block", "nix.demo")
data = block.create_data_array("response", "nix.sampled", data=response)
data.label = "voltage"
data.unit = "mV"
data.append_sampled_dimension(interval, label="time", unit="s")
stim_tag = block.create_tag("stimulus", "nix.stimulus_segment", position=[stim_on])
stim_tag.extent = [stim_off - stim_on]
stim_tag.references.append(data)
Line 11 creates the Tag with the start position and in line 12 we add the extent of the tagged segment. In line 13 we add the DataArray we want to point at to the list of references. A Tag can refer to more than just a single DataArray. Both position and extent are passed as lists with one entry for each dimension of the data. If the length of e.g. position is less than the number of dimensions in the referenced DataArray, it is assumed that the tag refers to the full extent of the non-restricted dimensions. The same applies to missing extents. For the sake of clearness it is advisable to fully specify the positions and extents.
Note! Position and extent of the tagged region are given as lists. Extent is optional, not setting it tags a point instead of a segment of the referenced data.
Tagging in 2-D
The same principle shown above for 1-D data extends to two or more dimensions. The only difference is that one has to provide vectors of positions/extents whose length matches the number of dimensions of the referenced DataArray.
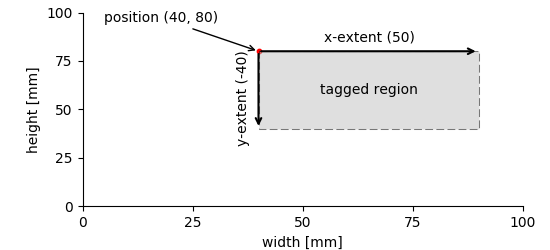
Tagging works also in 2-D. In this case, position and extent must be 2-element vectors (one entry for each dimension).
Tagging multiple points in 1-D
Often it is not a single point or region but a multitude of points that we want to note in a recorded signal. In the following situation a signal has been recorded and within this signal certain events, threshold crossings have been detected (figure below).
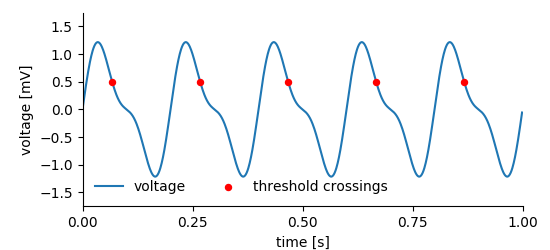
For storing this kind of data we need two DataArrays, the first stores the recorded signal, the other the events. Finally, a MultiTag entity is used to link both. One can use the event times stored in one of the DataArrays to tag multiple points in the other signal.
example code)¶ signal_array = block.create_data_array("signal", "nix.sampled", data=signal, label="voltage", unit="mV")
signal_array.append_sampled_dimension(sampling_interval, label="time", unit="s")
event_array = block.create_data_array("threshold crossings", "nix.events.threshold_crossings", data=events, label="time", unit="s")
event_array.append_range_dimension_using_self()
mtag = block.create_multi_tag("event tag", "nix.tag.events", event_array)
mtag.references.append(signal_array)
Creating the MultiTag is very similar to the creation of the simpler Tag above. The main difference is that the tagged positions are not stored in the MultiTag itself but we use the event DataArray (events in the code example) for this purpose. Finally, the signal DataArray is added to the list of references.
Tagging multiple intervals in 1-D
A very similar approach is taken for tagging multiple intervals in which, for example, a stimulus was switched on.
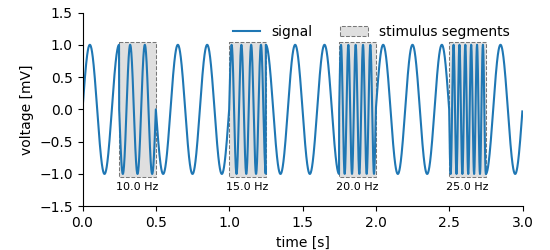
With a MultiTag we can also tag multiple regions in a signal.
For storing such data we again need one DataArray to store the recorded signal. Storing the regions is similar to the approach for the simpler Tag, i.e. positions and the extents need to be provided. Accordingly, two additional DataArrays are required. The first of which stores the positions and the second the extents of the tagged regions.
example code).¶ block = nixfile.create_block("multiple regions", "nix.session")
data_array = block.create_data_array("signal", "nix.data.sampled", data=signal)
data_array.label = "voltage"
data_array.unit = "mV"
data_array.append_sampled_dimension(sampling_interval, label="time", unit="s")
positions = block.create_data_array("stimulus onsets", "nix.region.onsets", data=stim_onsets)
positions.append_set_dimension()
extents = block.create_data_array("stimulus extents", "nix.region.extents", data=stim_extents)
extents.append_set_dimension()
mtag = block.create_multi_tag("stimulus segments", "nix.segments.stimulus", positions=positions, extents=extents)
mtag.references.append(data_array)
mtag.create_feature(frequencies, nixio.LinkType.Indexed)
The example code is rather straight forward. The DataArrays ‘positions’ and ‘extents’ take respective data and are added to the created MultiTag entity. Finally, the DataArray in which we tag the regions is added to the list of references of the MultiTag.
Tagging in n-D
The same principle as demonstrated above applies also to n-dimensional data. Tagging in n dimensions requires positions and extents stored in DataArrays of appropriate shapes.
The following figures show the tagging of multiple regions in 2- and 3-D.
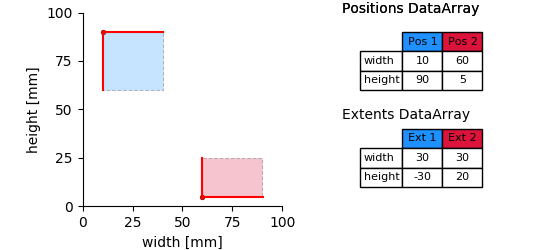
Tagging multiple regions in n-D data requires the DataArrays for storing positions and extents to be two-dimensional. The first dimension represents the number of regions, the second has as many entries as the referenced data.
According to the number of dimensions of the data (here, width and height) each starting point and the extent of a tagged region is defined by two numbers. Thus, the position and extent DataArrays are two dimensional. The first dimension represents the number of tagged regions, the second the number of dimensions.
This approach can be extended into n-D. The following figure illustrates the 3-D case.
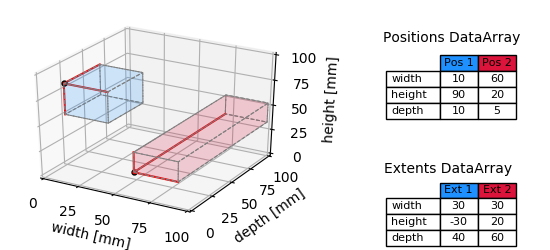
multiple_regions_3D_plot
The only things that need to be changed in the above code, are the layout of the data (now 3-dimensional) and further entries into position and extent DataArrays along the second dimension (compare tables in the figure). Again, these DataArrays are always 2-D, the first dimension represents the number of tagged regions, the second the number of dimensions.
For an example see Image data.
Adding features
We use the above example to increase complexity a bit. So far, the MultiTag ‘mtag’ just notes that in the data stored in ‘array’ there are some interesting intervals in which something happened. The name of the MultiTag entity tells us that the highlighted intervals represent stimulus regions. Using Features we can now add further information to these regions. Let’s assume we wanted to store the stimulus frequency. The following lines of code can be inserted into the previous example before the file is closed.
example code).¶ frequencies = block.create_data_array("stimulus frequency", "nix.feature", data=stim_frequencies)
frequencies.label = "frequency"
frequencies.unit = "Hz"
frequencies.append_set_dimension()
mtag = block.create_multi_tag("stimulus segments", "nix.segments.stimulus", positions=positions, extents=extents)
mtag.references.append(data_array)
mtag.create_feature(frequencies, nixio.LinkType.Indexed)
The feature data is used to create the text labels below the segments in the plot above (above). Each entry in the frequencies DataArray corresponds to one of the tagged sections. Thus we use the nixio.LinkType.Indexed flag while creating the feature. We can read the feature data that belongs to the respective position index by calling the feature_data method on the MultiTag.
        ax.text(interval + extent / 2, -1.25,
                "%.1f %s" % (mtag.feature_data(i, "stimulus frequency")[:],
                             mtag.features["stimulus frequency"].data.unit), fontsize=8, ha="center")
The Feature adds the information stored in a DataArray to the Tag/MultiTag. The way this information has to be interpreted is specified via the LinkType. There are three distinct types:
- Indexed: For each position in the referring Tag/MultiTag there is one entry in the linked DataArray. In case the linked DataArray is multi-dimensional, the number of entries along dimension 0 must match the number of positions.
- Tagged: Positions and extents of the referring Tag/MultiTag need to be applied in the same way to the linked DataArray as to the referenced data (stored in the ‘references’ list).
- Untagged: The whole data stored in the linked Feature is a feature of the Tag/MultiTag ignoring any indexing, positions or extents.
For more examples see the Spike time data tutorial.
Handling of units
In the above example we do not explicitly specify a unit for position and extent. They are implicitly assumed to be given in the same unit as the DataArray. It is, however, possible to specify a unit (or rather a unit for each dimension), if this is more convenient. For example, it would be possible to give position and extent in milliseconds while the DataArray is specified in seconds. The library will try to convert the units transparently. The library does no validation at the time of Tag creation. It is the user’s responsibility that units match or are scalable. Unit conversion works only for SI units and is ignorant of physical connections between units. That is, we can work with W and mW but can not scale mW and VA (milli Watts and Volt * Ampere).